Archive for June 2008
Cash Return on Invested Capital and Weighted Average Cost of Capital Calculations
Over the last several weeks, I’ve been asked about my calculations for Weighted Average Cost of Capital (WACC) and Cash Return on Invested Capital. At some point, I’ll run through the specific calculations and logic behind them. Until then, allow me to provide the calculations which appear on the spreadsheet used for equities analysis postings.
UNH, Computer Issues, and Plans For The Future
[06/19/08 Update on computer status at end]
[Quick Analysis of UNH at end]
During a business trip to Richmond, my external hard drive was fried. This has made analyzing equities exceedingly difficult — since the files used for that purpose were on that drive. Since returning, efforts to recreate them have run into glitches on my tower computer. A trip to the UNC bookstore earlier today, to say nothing of a healthy dent to the wallet, and repair of the computer (upgrading to Office Professional 2007) is now underway. The professionals have my old hard drive (attempting to recover the files), but this will take a week or more, and recreating the system from scratch will take nearly as long. So, I’m temporarily out of commission on the investing side.
Temporary Personnel Services Sector — Top-Down Value Profile
It makes sense that they would show up on my screens for out-of-favor stocks. Anything having to do with Personnel Services comports with the legal definition of hearsay — assuming as true what has yet to be proven. In this case, even considering personnel services assumes there are personnel and, defacto, services sufficient to keep them employed. With the economy suspect and the unemployment rate rising, why would any sane investor consider this sector?
Well, why would any sane investor ignore it?
Hansen Natural (NYSE: HANS) — 06/04/08

Value investing represents a “Tale of Two Cities” — where the stock represents the best and the worst of times. On the one hand, we seek a company that is performing competently and growing. On the other hand, we seek a stock price that is in the toilet. At its core, value investing is a disconnect between the bipolar psychology of Mr. Market and the intrinsic value of the company. The efficient market theorist would have us believe this is impossible, but the market’s volatility in the absence of actionable information suggests otherwise. Hansen Natural (NYSE: HANS) seems a case in point — where the company is doing well but the stock price has been unreasonably hammered (thank you, Shorts).
![]()

I don’t know whether the stock was overvalued at its peak. That is not the subject of this analysis. I have every reason to believe, however, that it is undervalued at today’s price, and that is the subject of this article.
Company Description
SEC filing description of the company:
Hansen Natural Corporation, through its subsidiaries, engages in the development, marketing, sale, and distribution of beverages in the United States and Canada. It offers natural sodas, fruit juices and juice drinks, energy drinks and energy sports drinks, fruit juice smoothies and functional drinks, non-carbonated ready-to-drink iced teas, lemonades, juice cocktails, and children’s multi-vitamin juice drinks. The company also provides energy drinks under the Monster Energy, Lost Energy, Joker Mad Energy, Unbound Energy, and Ace brand names, as well as the Rumba brand energy juice. In addition, it markets and sells Java Monster non-carbonated dairy-based coffee drinks; natural sodas, premium natural sodas with supplements, organic natural sodas, seltzer waters, sports drinks, and energy drinks the under Blue Sky brand name; and non-carbonated lightly flavored energy waters under the Hansen’s brand name. Further, the company provides vitamin and mineral drink mixes in powdered form under the Fizzit brand name. Its customers include retail grocery and specialty chains, wholesalers, club stores, drug chains, mass merchandisers, convenience chains, full service beverage distributors, health food distributors, and food service customers. The company was founded in 1985 and is based in Corona, California.
Fundamental Overview
The company enjoys a strong financial posture. Yahoo Finance reports the following:
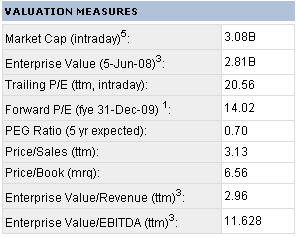
The forward price-earnings multiple is expected to come in at 14.02, with a price-to-earnings-to-growth (PEG) ratio significantly below 1.0. It should be noted that the price to sales and the price-to-book values exceed the normal value investing thresholds. In other words, Hansen is not undervalued based on these metrics.

The profitability and management effectiveness results, on the other hand, are exceptional — especially the return on equity, which exceeds 45%.

The key figures in the previous graphic are the year-over-year results for revenues and earnings, posting 27.9% and 42.6%, respectively. While the core data provided (below) will focus on the year-over-year results, these figures provide shorter-term investors with an indication that earnings and revenues are growing intra-year.

The company’s total debt/equity ratio, at 0.001, is abundantly healthy, and the current ratio at 3.966 provides our first indication that the company is an unlikely bankruptcy candidate. This is confirmed by the Altman-Z Score:

At 27+, the company significantly exceeds the 1.81 threshold indicating a bankruptcy threat, to say nothing of the top-end grey-zone figure of 3.0.

The short ratio of 4.1 (25.5% of the float) represents an increase of shares short from 17.8 6 million last month to 19.9 6 million as of May 12. This serves to explain the recent price decline in the stock. To fully understand this, it is helpful to recognize that insiders accounted for 16.99% and institutions accounted for a further 88% of the outstanding shares. Therefore, a relatively small number of shorts have the ability to move the stock price disproportionately on any given day. Neither, insiders nor institutional holders are known for day-trading. Our goal, as value investors, is to allow the market to exercise its depressive psychosis to our benefit — providing buying opportunities that would not otherwise be available if the market were truly efficient.
Financial Analysis
Turning to the 10K figures:
Gross Profit.

Revenues have been parabolic, and gross profit exceeds cost of goods sold.
Operating Expenses

The decline of sales, general, and administrative expenses in 2006 and the commensurate rise in “other” represents a change in accounting methods. The increase in this category, however, is consistent with the increase in sales. For those who require further evidence, the company describes their allocation of capital as follows:
Operating Expenses. Total operating expenses were $237.0 million for the year ended December 31, 2007, an increase of approximately $79.0 million or 50.0% higher than total operating expenses of $158.0 million for the year ended December 31, 2006. Total operating expenses as a percentage of net sales was 26.2% for 2007, slightly higher than 26.1% for 2006. The increase in operating expenses in dollars was partially attributable to increased out-bound freight and warehouse costs of $8.7 million primarily due to increased volume of shipments, increased expenditures of $18.4 million for sponsorships and endorsements, increased expenditures of $10.3 million for commissions and royalties, increased expenditures of $4.9 million for sampling programs, increased payroll expenses of $12.1 million, increased expenditures of $8.6 million for professional services costs, including legal and accounting fees, and increased expenditures of $2.5 million relating to the costs associated with terminating existing distributors. Included in legal and accounting fees are costs of $9.8 million (net of $2.5 million insurance reimbursements) in connection with our special investigation of stock option grants and granting practices, related litigation and other related matters. Total operating expenses, exclusive of expenditures of $15.3 million and $12.7 million for 2007 and 2006, respectively, attributable to the costs associated with terminating existing distributor and exlcusive of expenditures of $9.8 million (net of 2.5 million in insurance reimbursements) and $3.8 million for 2007 and 2006, respectively in connection with our special investigation of stock option grants and granting practices, related litigation and other related matters, as a percentage of net sales, were 23.4% for both 2007 and 2006.
Taxes

Taxes paid are in-line with expectations and growing at a rate below earnings.
Cash Flows From Operations

This is as expected; although, it did marngally separate from net income in 2006. All other contributors were not material.
Cash From Investments
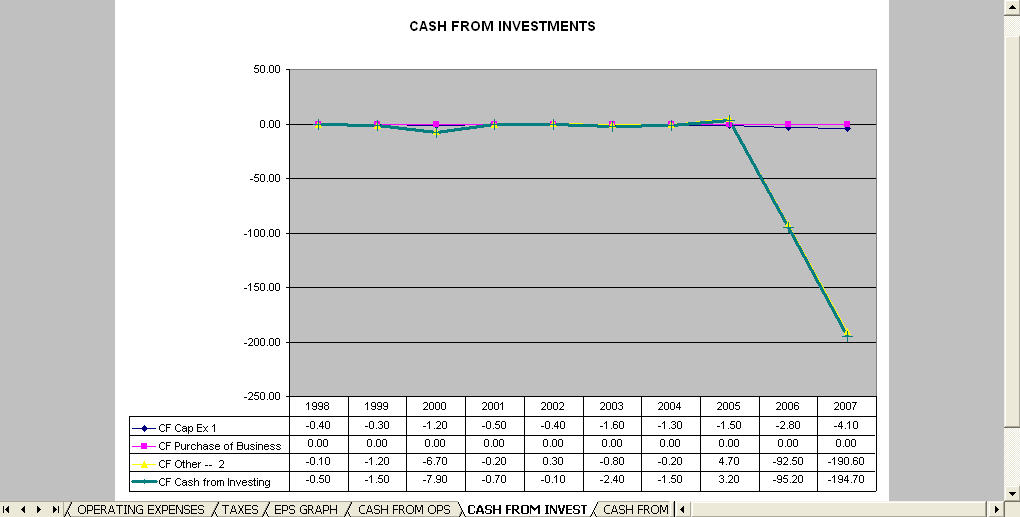
Cash flows used in investing activities – Net cash used in investing activities was $194.7 million for the year ended December 31, 2007, as compared to $95.2 million used in investing activities in the comparable period in 2006. For 2007, cash used in investing activities was primarily attributable to purchases of short- and long-term investments, particularly available-for-sale and held-to-maturity investments. Cash provided by investing activities was primarily attributable to sales and maturities of held-to-maturity and available-for-sale investments. For both periods, cash used in investing activities included the acquisitions of fixed assets consisting of vans and promotional vehicles and other equipment to support our marketing and promotional activities, … .
Cash from Financing

Exposure to Financial Liquidity Crisis
The company does have exposure to the recent financial-market liquidity “crisis.”
At December 31, 2007, we had $12.4 million in cash and cash equivalents and $290.2 million in short- and long-term investments.
Their exposure to auction rate securities (ARS) has been shifted from short-term to long-term. At $237 million, operating expenses are more than covered by gross profits of more than $468 million (for a 51.7% gross operating profit as a percentage of net sales). If seeking to determine the impact on capital expenditures, I came up with the following estimates:

These calculations are designed to segregate growth and maintenance capital expenditures as a check against declared depreciation. The net difference over the past decade amounts to less than 1%. With declared cash of over $12 million and a current ratio of 3.966, the company appears to have sufficient working capital to accommodate the recent liquidity issues within the broader financial markets, as indicated by this graph comparing free cash flow is to capital expenditures:

Moreover, free cash flows of $131 million provides complete coverage of current liabilities ($76 million) plus capital expenditures ($4.1 million), combined, with a margin of safety of more than $50 million ($131 – $76 – $4.1).
Assets

Total current assets leveled off from 2006 to 2007, as the company evidently invested in growth through inventories and accounts receivable with a decline in cash and cash equivalents. The cash and equivalents decline was also due to added plant, property, and equipment and the conversion of ARS investments to long-term assets from short-term assets.

In addition to the ARS conversion, the increase in other long-term assets includes expansion of the company’s unique emphasis on trial marketing, which is described in the 10K filing:
Our sales and marketing strategy for all our beverages and drink mixes is to focus our efforts on developing brand awareness and trial through sampling both in stores and at events. We use our branded vehicles and other promotional vehicles at events where we sample our products to consumers. We utilize “push-pull” methods to achieve maximum shelf and display space exposure in sales outlets and maximum demand from consumers for our products, including advertising, in-store promotions and in-store placement of point-of-sale materials and racks, prize promotions, price promotions, competitions, endorsements from selected public and extreme sports figures, coupons, sampling and sponsorship of selected causes such as cancer research and SPCAs, as well as extreme sports teams such as the Pro Circuit – Kawasaki Motocross and Supercross teams, Kawasaki Factory Motocross and Supercross teams, Robby Gordon Racing Team, Kawasaki Factory International Moto GP Team, Kenny Bernstein Drag Racing Team, extreme sports figures and athletes, sporting events such as the Monster Energy® Supercross Series, the Monster Energy® Pro Pipeline surfing competition, Winter and Summer X-Games, marathons, 10k runs, bicycle races, volleyball tournaments and other health and sports related activities, including extreme sports, particularly supercross, motocross, freestyle, surfing, skateboarding, wakeboarding, skiing, snowboarding, BMX, mountain biking, snowmobile racing, etc., and we also participate in product demonstrations, food tasting and other related events. In store posters, outdoor posters, print, radio and television advertising, together with price promotions and coupons, may also be used to promote our brands.
Liabilities

The increase in current liabilities is consistent with the increase in inventories, designed to drive sales expansion.

While current liabilities accounts for the majority of the increase in total liabilities, other long-term liabilities increased from $5.4 million to $20.5 million from 2005 to 2006 and from $20.5 million to $39.6 million from 2006 to 2007. The 10K indicates this is primarily due to a canning contract with Rexam Beverage Can Company, having a maximum $6 million liability. The remainder is primarily attributable to leases:

The $50 million in excess free cash flows (described earlier), should be sufficient to cover the $37.5 million due in the current year. Lease obligations decline thereafter.
Shareholder’s Equity
The company’s strong operating margins are best put into perspective with a chart that compares the growth of liabilities to shareholder’s equity.

Investment Ratios
With each of the investment ratios, we will consider the results from two perspectives.
The first will provide the yearly results, with overlaid process control charts. Process control charts consider the level of performance variation and apply one, two, and three standard deviations above and below the mean. The process control results for the first five years of the 10-year results are not trended, while the results for the most recent five years is. This will allow us to do things. First, I will provide an indication of whether the most recent multi-year performance exceeds the norm by a statistically significant amount. Second, it will allow us to put the most recent year’s performance results into perspective.
The second chart considers the year-over-year rate of growth or decline and contrast it with the company’s long-term rate.
The first item to consider is Owner’s Earnings — a Warren Buffett measure. Owner Earnings adjusts reported earnings for a number non-cash items and maintenance capital expenditures. In the Berkshire filing of 1986, Mr. Buffett describes it as follows:
These represent (a) reported earnings plus (b) depreciation, depletion, amortization, and certain other non-cash charges such as Company N’s items (1) and (4) less ( c) the average annual amount of capitalized expenditures for plant and equipment, etc. that the business requires to fully maintain its long-term competitive position and its unit volume. (If the business requires additional working capital to maintain its competitive position and unit volume, the increment also should be included in ( c).
…
Our owner-earnings equation does not yield the deceptively precise figures provided by GAAP, since( c) must be a guess – and one sometimes very difficult to make. Despite this problem, we consider the owner earnings figure, not the GAAP figure, to be the relevant item for valuation purposes – both for investors in buying stocks and for managers in buying entire businesses. We agree with Keynes’s observation: “I would rather be vaguely right than precisely wrong.”


The most recent owner’s earnings results significantly exceed the range established over the first five years. The 2007 results, which represent an increase over 2006, falls marginally below the trended one standard deviation line, indicating that the most recent results are consistent with the trend and would be expected in 68 percent of yearly results (or more). The year-over-year chart indicates a return to the 50 percent growth range — which significantly exceeds Buffett’s reported preference for growth in excess of 15 percent.
Having provided the logic behind reading these two charts in combination, I will provide similar charts for other investment measures, starting with book value.

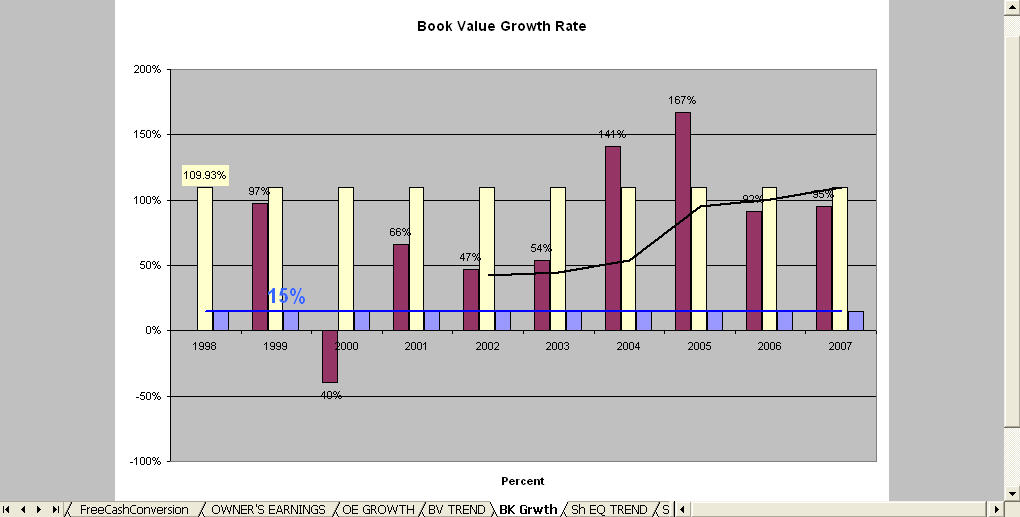
Book value follows owner’s earnings for a reason. We expect that owner’s earnings will translate into book value, which should translate into shareholder’s equity. In this case, owner’s earnings translation into book value is exceedingly efficient. In fact, the 2007 book value growth results exceeded the upper one standard deviation line.


And the translation of book value and owner’s earnings into shareholder’s equity has been impressive, as well. Note that the year-over-year growth in the last four years has trounced the 10-year average.
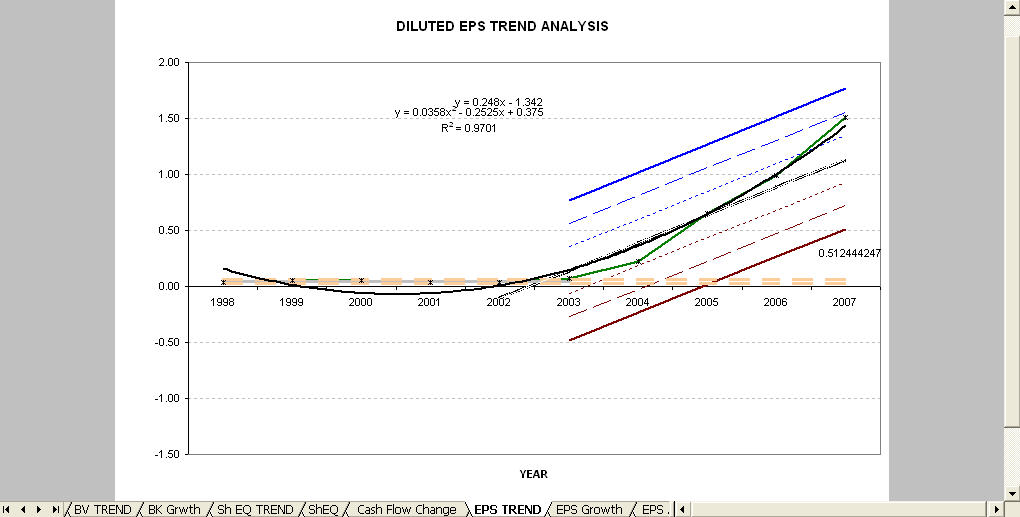
Diluted earnings per share may be getting a head of itself, as it approaches the trended two standard deviation line (96.8 percent of expected events). This is most likely due to the accounting anomalies described by Buffett, where net earnings consider a number of non-cash items that are not germane to investors or the company’s senior leadership. Earnings per share, however, are what uninformed investors use as a measure of company performance, and, if these results revert to the mean over the short term, the stock price may take a temporary hit.

The Securities Market Line chart is similar, in that it considers the stock’s volatility as a measure of whether the equity return exceeds the broader market’s. Stock price volatility, however, is a market circumstance that may have nothing to do with the performance of the company. Nevertheless, when a company’s results are above the securities market line, the investor is rewarded for the stock’s price volatility. In the case of Hansen, the results are exceptional, even through the volatility is well above the norm for the broader market.
Return on invested capital is not a market effect, and the Hansen results are impressive.

Benjamin Graham sought ROIC results for stable and established firms in excess of 6 percent. For all others, he demanded 10 percent. Hansen exceed both in every year for the past decade. Moreover, the most recent results have been above the five-year and ten-year averages.
Stock Valuation
Discounted Cash Flow Analysis
Discounted Cash Flow Analysis projects bankable profits in the future and discounts them back to today’s dollars. DCF is only as good as the projections, however. Nevertheless, it provides a basis on which to arrive at an informed estimate of per-share value.
We start with the relevant financial information.

Consider free cash growth rates by calculating the median over rolling five-year and seven-year time frames:

And take the median of the rolling medians. For Hansen, this comes in at a whopping 59 percent growth rate. Is this sustainable? Not according to what I was taught in business school.
So, let’s cut that growth rate by 25 percent over the next three years and reduce it further by 10 percent increments as follows:

This gives us out-year free cash projections of:

We would ordinarily discount these future cash flows back to present dollars at a 10 percent Net Present Value rate. To be exceedingly conservative, however, we will increase that by 50 percent and use 15 percent as the discount rate. This would, however, identify the value of the company without consideration of cash flows beyond twenty years or the accrued value of the company, its savings, or assets today. The be conservative, we will use current shareholder’s equity as the residual value of the company and add it to the net present value of the projected cash flows over the next 20 years.

Divide the results by the current shares outstanding and the company is worth $103.87 per share.
At various points, our calculations have been exceedingly conservative. We reduced expected cash flows by 25 percent over the next three years and made additional 10 percent cuts thereafter. We took the median of the median, rather than employing averages. We used a 15 percent NPV rather than a 10 percent NPV rate. And we used current shareholder’s equity as the residual value of the company beyond the next 20 years. To add another layer of conservatism, we demand a 50 percent discount from the per share value in identifying our maximum purchase price. Half of $103.87 is $51.94. With the stock selling at my personal purchase price of around $32.80 ($32.99 to be precise), the actual discount to intrinsic value ($103.87) was around 68 percent, and the potential gain on the purchase is over 300 percent.
Of course, it may take the market a while to fully value the stock. So, we should consider the compounded rate of return at various time frames.

Even if it takes 5.5 years, the return is above 20 percent and far exceeds the norm for the stock market.
All of this, however, assumes a growth rate that is beyond the maximum sustainable level of 30 percent. To calculate the degree to which the stock us under- or over-valued at different growth rates, we perform sensitivity analysis:

This indicates that the stock is under-valued by 31 percent if the growth rate is 30 percent for the next three years, followed by the same 10 percent reductions, and it is undervalued by 11 percent if that growth rate drops to just 25 percent. Breakeven is a growth rate of 22.73 percent. Growth, therefore, can decline from 59 percent to 22.73 percent before stockholders have overpaid for part ownership of the company, if purchasing the stock at $32.80.
Replication Value

How much would it cost a new competitor to enter the market and achieve the equivalent stature and market share of Hansen? Yahoo Finance lists the book value at $4.83 per share. Using the Graham approach, replication value comes in at something around $5.08. The current stock price is, therefore, selling at 6.46 times its replication value.
This price-to-adjusted-book value is very high, and it would be a concern if Hansen were an operations intensive concern — high in plant, property, and equipment. With an infrastructure value of just $8.6 million out of total assets of $544.6 million, price-to-adjusted-book is not the way to value the company. Clearly, Hansen’s value is driven by the end product and its popularity among consumers.
To get at this, it is necessary to consider the company’s earnings power and franchise value.
Earnings Power and Franchise Value
The earnings power of the company is the company’s earnings divided by its cost of capital plus the difference between cash and debt. To get at this, we must calculate the weighted average cost of capital:

WACC, which considers the cost of debt (and the tax shield benefits) and the expected return on equity financing, should be less than the cash return on invested capital — otherwise, growth degrades the stock value. In this case, CROIC exceeds WACC by nearly one percent, and the entirety of WACC is attributable to equity. This provides a measure comfort for the company and stockholders due to the low level of leverage. We will, nevertheless, use 13.37 percent as WACC for calculation of earnings power.

The table above provides the concluding figures for the calculation of Earnings Power Value, with sensitivity analysis on top and a comparison of EPV to Replication Value (RV) below. As long as EPV exceeds RV, the company can grow profitably and franchise value exists … in the current year, at least. EPV must typically exceed RV for a number of years for this strategic and financial benefit to be reliably reflected in the stock price, according to Professor Bruce Greenwald of Columbia’s Business School. Here are the yearly figures:

And a chart that graphically depicts the relationship:

So, What is this Stock Worth?
My friend Joe Ponzio at Meridian in Chicago has produced a chart that compares two methods of calculating intrinsic value and comparing it with the stock price movements. While I am proud to say that Joe and I worked on this together, the concept, design, and layout are his creation. Both use Discounted Cash Flows as the basis but make marginal changes to the calculations. The first is founded on the original approach created by John Burr Williams and modified by Monish Pabrai, and the second is Joe’s approach — which is typically more generous. The benefit of considering both is that they provide a range of intrinsic value and neither requires more than 10 years of data for calculation of intrinsic value in the early years.
Here are the initial assumptions:

Note that we have reduced the growth rate for the first three years to a more sustainable 30 percent.

By this measure, the stock is significantly undervalued, even though it did get ahead of itself in the middle of 2006 and October of 2007. At 30 percent free cash growth, intrinsic value is $57.79.
If we reduce the initial growth rate to 20 percent, the stock is fairly valued today.

It should be understood that fair value is not a negative if the company is growing and/or generating profits for the owners. That is why our earlier consideration of operating margins and free cash flows was important. In the case of Hansen, where profits are strong and growth is abundant, both provide another measure of comfort for stockholders.
Investment Thesis
Hansen’s principle growth driver is energy drinks which provide a punch to the system that is stronger than coffee. Those wagering on the stock’s decline maintain that energy drinks are a fad and that, with a declining economy, consumers will be less willing to devote dwindling discretionary incomes to energy drinks. In past recessions, however, several themes have emerged which suggest this pessimistic thesis may be wrong.
The US consumer and the US worker are one and the same — with both possessed of the same competitive spirit. We may complain about combating foreign competition on an uneven playing field, but we are loath to exit the stadium of competition. That was our response during the 70s and 80s when the Japanese were purchasing Rockefeller Center and threatening to buy Hawaii, when we were compelled to ramp up our productive infrastructure at the start of World War II, and, more recently, in the face of European economic consolidation and the creation of the EU. I expect the same response to the economic emergence of China, India, Brazil, and Russia. In this more competitive climate, where low wages and cost of production in emerging markets will confront the competitive spirit, practical ingenuity, and efficiency of the US market and workforce, workers will seek to produce more in less time, and, just as the coffee break has been long viewed as a benefit to office productivity, the stronger power of energy drinks will be perceived by workers seeking to retain employment in a down economy as a differential advantage. And this bodes well for Hansen — especially, as our overseas competition does likewise.
My only concern about this thesis is the number of new energy-drink offerings introduced by the company — believing that these may serve to cannibalize Monster (Hansen’s leading product) market share and profitability while increasing the cost of production for this expanding menu of offerings. During a talk with students at the University of Florida, Warren Buffett indicated that Coke is one of the few drink products where the consumer never tires of the taste … and he is right. If viewed in this light, the new offerings by Hansen may well serve to expand market share with limited cannibalization. The customer is unlikely to purchase an other Hansen product in place of Monster if seeking an taste alternative in the first place.
Moreover, product segmentation is a natural and beneficial market progression — seeking to more fully satisfy customers and cultivate buyer loyalty to their preferred brand. Intelligent branding and market segmentation (especially for growing segment categories, such as energy drinks) represent a potential positive. As Hansen seeks to expand market share and consumer loyalty, the franchise value of the company should grow and deepen its moat — barriers to competitor entry –, where share of mind becomes more important than share of market as a predictor of future success.
Conclusion
Hansen is buy below $52 a share and a strong buy below $45.
Sears — Supposition About Real Estate Value
There is a lot of supposition concerning the real estate value of Sears. While I suspect the company has a fairly accurate feel for this (they have an executive vice-president of real estate), real estate is one of those things for which no precise measure is available until buyer and seller enter into a binding contract. Nevertheless, DingoJoe, who seems marginally down on the stock, posted an interesting comment to my original assessment of Sears:
With regards to their real estate, Credit Suisse did a study earlier this year where they estimated the value of the RE at $4.7 Billion. Hank Greenburg at Marketwatch had an anonymous analyst say that he could make a case for a negative value of Sears RE (take that with a grain of salt though). Their premiere brands still have value, though even that value shrinks every year as Sears/KM sales shrink.
Indeed, Credit Suisse did value Sears real estate holdings at $4.7 billion, according to a January 2008 WallStreet Journal article.


So, let us consider the $4.7 billion figure. Currently, the company lists the value of its real estate holdings at $1 billion. If we do as Benjamin Graham advised and adjust the assets and liabilities to remove non-capitalized items (such as intangibles) and mark down such items as accounts receivable but add back the additional $3.7 billion in real estate holdings that Joe asserts Credit Suisse believes are not reflected in the financials, we come up with the following adjusted book value calculations:

This puts an adjusted book value on the stock of $104.29. At today’s intra-day price of $83.39, the stock is selling at a 20 percent discount to adjusted book (if the $4.7 billion real estate value is accurate).

This gives the stock a potential gain of 25 percent ($104.29 divided $83.39).
It should be noted that these figures are based on the latest 10K and does not factor in quarterly results. Additionally, I should mention (again) that I have a small long position in the stock (around $835). And, once more, please keep in mind that the actual real estate value is unknown.
CQI In Complex Industries
The distinction between Total Quality Management and Continuous Quality Improvement is that CQI has been modified for healthcare environments. While earlier postings discuss the success of TQM on the factory floor and in production operations, it may be helpful to contrast that side of industry with something more akin to healthcare, such as information technology (especially, software design and development).
Initial Investment Screening
In the past, I have mentioned that I can consider a large number of stocks and quickly narrow the list down to a small number of promising candidates, using a programmed Excel file I created about a year ago. This posting describes the approach.
