Biovail Valuation — BVF
Recently, Biovail announced plans to restructure its strategic focus. This analysis of the company’s stock and intrinsic value was created before that announcement and removed as almost immediately afterwards. I’ve decided to repost it, however. While the restructuring fundamentally changes the company and its future prospects, it may be helpful to understand its prospects under the prior environment — serving as a point of departure for more updated analysis. While I still own the stock, I have no plans to update this assessment until receiving the next several 10Qs. It is one thing to have have a plan and another to execute it. In the case of Biovail, it is one thing to have a successful history of growth and another to successfully alter the foundation on which that history achieved success.
Please note that I remain an equity owner due to the attractive dividend and the company’s prior success and experience in those areas that now constitute the strategic focus — medicines related to central nervous system diagnoses.
_____________________________________
Before us is the appropriate valuation of Biovail’s stock. We will consider this from the perspective provided by several different valuation methods — specifically, discounted cash flow analysis, net asset value, replication value, and Earnings Power Value.
For those not familiar with the company, the firm’s description provided to the SEC is as follows:
Biovail Corporation, a pharmaceutical company, engages in the formulation, clinical testing, registration, manufacture, and commercialization of pharmaceutical products utilizing various drug-delivery technologies in the United States and Canada. The company principally focuses on central nervous system disorders, pain management, and cardiovascular diseases. It offers Wellbutrin XL for the treatment of depression in adults; Ultram ER for the management of chronic pain in adults; Zovirax Ointment for the management of initial genital herpes; Zovirax Cream for the treatment of herpes labialis; and Cardizem LA that provides blood pressure control. The company also provides Tiazac/Tiazac XC for the treatment of hypertension and angina; Wellbutrin SR/Zyban for the treatment of depression; Monocor for the treatment of mild to moderate hypertension and congestive heart failure; Retavase, a tissue plasminogen activator used in thrombolytic therapy; Glumetza to control hyperglycemia in adult patients with non-insulin dependent and mature onset diabetes; and Ralivia for the management of pain in patients. Its legacy products comprise Cardizem CD medications in the calcium channel blocker category of cardiovascular drugs; Ativan for the management of anxiety disorders, short-term relief of anxiety, or anxiety associated with symptoms of depression; Tiazac used in the treatment of hypertension and angina; Vasotec/Vaseretic for the treatment of hypertension, symptomatic congestive heart failure, and asymptomatic left ventricular dysfunction; and Isordil to treat prophylaxis of ischemic heart pain associated with coronary insufficiency. The company’s generic products consist of bioequivalent formulations of Cardizem CD, Adalat CC, Procardia XL, Tiazac, Voltaren XR, and Trental. In addition, Biovail Corporation offers research, development, and clinical contract research services to third parties. The company was founded in 1983 and is headquartered in Mississauga, Canada.
It is beyond the scope of this analysis to perform an assessment of the strategic positioning and slate of product offerings, recent FDA approvals, and the company’s pipeline of products and medications. Instead, we will focus on the calculation of intrinsic value based on future growth rates, the value of the company’s assets, the cost to a competitor to replicate what the company has achieved during its life thus far, and the degree to which there is franchise value. With the exception of discounted cash flow analysis, each of these takes a look at the current state of the company — i.e., a single year assessment.
As of April 20 5, 2008, Yahoo Finance reports the following:

Benjamin Graham, the father of value investing, recommended a threshold price-to-book value of 2.5 or less. By General convention, enterprise value/EBITDA should fall below 10.0. A price-earnings multiple less than 15.0 is come also, consistent with a value perspective.
Consider, as well, the company’s market capitalization of $1.79 billion and its enterprise value of $1.39 billion. In general, these indicate that the company is not a speculative play based on market size — exceeding our $500 million minimum.
Next, we turn to the company’s debt posture.
Please note the absence of debt. This indicates that the principal source of the company’s Weighted Average Cost of Capital is the cost of equity (i.e., stock). This will become an important factor when considering the company’s Earnings Power Value (EPV). Additionally, the current ratio of 1.923 is close enough to our target of 2.0 to continued consideration of the company as a value stock.
The $8.06 attributable to book value serves as the baseline for identifying the company’s intrinsic value. It is important to recall that book value indicates the net asset value is the purchase value of the assets. These may have significantly increased since original purchase. Consequently, $8.06 should constitute the lowest reasonable valuation of the company. It does not, however, take into account the company’s future growth prospects, the value of its research and development, its investment in marketing and market development, it’s brand value, et cetera. It is, simply, a minimum valuation from which to contrast the company’s current market price of $11.14 (as of April 25, 2008). The company is, therefore, selling at 37.7% above its listed book value. By Graham standards, the company could sell for 150% above book value and still constitute a “value stock.”
Next, let’s look at the replication value — the amount that a new competitor in the marketplace would reasonably expect to invest in order to achieve parity with today’s Biovail. Here are the figures for this calculation:

(Please click on the image, above, to make the image readable.)
We will leave it to the reader to verify our calculations, but the pertinent portion of the image above is:
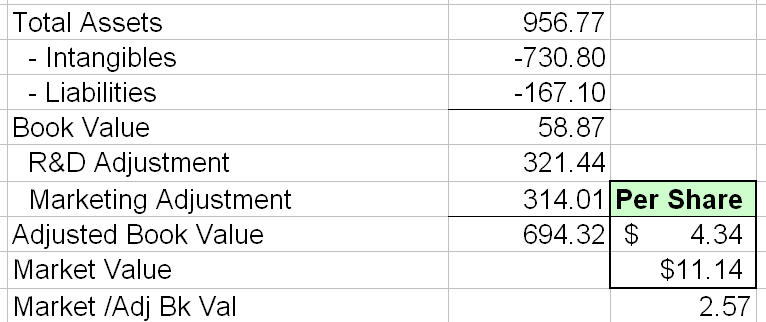
This indicates an adjusted book value of $4.34, compared to the $11.14 in current market value. The difference in the previously quoted book value is attributable to acquired debt in building the business. This produces a market value-to-adjusted book value of 2.57 — marginally above the Graham standard.
Next, we turn to the question of calculating its “franchise” value. This values the company’s ability to generate more than one dollar in growth for every one dollar invested in that growth. The reader should think of this as a quantitative reflection of the company’s “differential advantages” — what Warren Buffett calls a “moat.” The calculations for this estimate are:

Please note that this accords value to such items as marketing and advertising (i.e., brand creation) and research and development. Additionally, it uses the Weighted Average Cost of Capital as the company’s cost of capital in calculating the Earnings Power Value (EPV). The next screen capture looks more closely at the results:

These figures identify an intrinsic value of $45.91 based on a cost of capital up 9.54%. This is the current weighted average cost of capital (the calculations for which will be provided shortly). At this cost of capital, the company’s stock is currently selling at a 76% discount off of its intrinsic value, if that intrinsic value is calculated based on Earnings Power Value. Please note, as well, Return on Invested Capital (at 21.62%) significantly exceeds its Weighted Average Cost of Capital (at 9.54%). Also, note that this provides a sensitivity analysis for the per-share value at various Cost of Capital levels . For example, if anticipating that the cost of capital will increase to 12%, the intrinsic value decreases to $36.40.
Here are results when calculating Weighted Average Cost of Capital and comparing that with Cash Return on Invested Capital:

Please note that Debt is non-existent. Consequently, the true WACC is 8.6 percent (with the 0.94 percent atrributed to debt designed to avoid the Div/0 error in Excel).
It should be noted that identifying the intrinsic value based on net asset value, replication value, and earnings power value do not take into account historic growth rates. In other words, they are not “backwards-looking” beyond the previous year’s results. In order to consider the influence of growth on the value of a company, it is necessary to calculate the discounted cash flows.
Here is the broad overview of the calculations related to discounted cash flow analysis:

Please note that discounted cash flow analysis assumes the current value of the company is the total cash that may be taken out of it (today and in the future), discounted back into present dollars. To perform this calculation, it is necessary to make a small number of assumptions. Our analysis, initially, assumes that the company’s historic free cash flow growth rate will continue for the next decade, followed by a 5% growth rate for the second decade. Additionally, beyond 20 years, the calculations become increasingly speculative. To minimize that speculation, we use current shareholders equity as the continuing value of the company beyond 20 years. Because this is measured in current dollars, no discount for shareholders equity is necessary. Moreover, these calculations assume a conservative discount rate of 15% (most analysts use a 10% discount rate).
The germane portion of these results are:

This indicates an intrinsic value of $85.04 for this $11.14 stock — representing an 86.90% discount off of its intrinsic value. This implies an up-side potential gain in excess of 760%, if the stock should realize its intrinsic value. Please note, as well, that the company posts a 17.16% free cash flow yield, and a 72.81% shareholder’s equity yield. The 1/2 Kelly Criterion indicates that no more than 47.4% of an investor’s portfolio should be devoted to the stock — which is well in excess of the 20 percent necessary to achieve diversification with a minimum of 5 portfolio holdings. These calculations, however, rely on the free cash flow growth rate progressions over the next decade. It is, therefore, appropriate to consider how these projections were calculated and to determine the extent to which they are reasonable.

To identify the free cash flow growth rate over the next decade, we have calculated the five-year and seven-year rolling median free cash flow growth rates for the prior decade . Use of the medium rather than be mean or average provides a more reasonable and conservative basis for considering this important issue. Thereafter, the median of these results (i.e., the rolling five-year and seven-year medians) is then calculated to identify the historic growth rate for free cash flows. In the case of Biovail, the historic growth rate is 29.2%. This is significantly above the norm for the marketplace, and, even for “growth” companies, it approaches the maximum sustainable five-year growth rate of 30%. This seems optimistic.
We should, therefore, perform sensitivity analysis at various rates of growth (for the next decade) and calculate the degree to which the Company’s current stock price represents a discount from its intrinsic value at those growth rates. Here are the results:

By discountied cash flow analysis, the company’s stock value currently represents a discount from its intrinsic value of 45%, if assuming a 0% free cash flow growth rate over the next 10 years. Even if descending to a -10% free cash flow growth rate over the next decade, the company’s stock is undervalued by 28%, according to discounted cash flow analysis.
The next chart considers the compounded annual rate of return, assuming the company continues to post free cash flow growth rates at just over 29%. As indicated previously, this is not the expected future rate, but it does indicate the maximum potential return if the stock realizes a value of $85.04 at various points in time during the next 5 1/2 years.

Given all this, it is reasonable ask, “What is the intrinsic value of Biovail?” While the figures provided above suggest an assortment of different estimates (from just over eight dollars a share to more than $80 a share), it appears the actual value of the company is approximately $40 a share, using the EPV results ($45.91) and applying a 50% margin of safety to the $85.04 estimate of intrinsic value through discounted cash flow analysis ($85.04 / 2 = $42.52). A valuation of $40 a share, therefore, seems reasonable, but this assumes (by DCF) a 15.4% free cash flow growth rate over the next decade.
At 15.4% and an intrinsic value of $40 per share, the compounded rates of return at various time frames is:

According to Monish Pabrai, most undervalued firms reach their intrinsic value within 18 months. Even if doubling that to three years, the compounded annual rate of return is 53.14 percent. Even if reducing that by half, gains in excess of 25 percent far exceed the historical stock market averages.
Regardless, Biovail seems a legitimate value investment choice. Investors should take into account the company’s competitive position, pipeline of products, and the acumen of management. The stock valuation provided here is just a first step in analyzing the company and its suitability for your portfolio of investments.
[Much of the DCF analysis uses the model created by Joe Ponzio at FWallStreet.com.]
_________________________________________________________________________________________________
Frank (on the Yahoo message board) suggests that last year’s decline in free cash flows is significant and cause for investor alarm. The reality appears to be different, as the prior year’s decline falls within the three standard deviation upper and lower control limits of the trended process control chart. In other words, the year-over-year variation in results are consistent with random noise fluctuations and violate none of the WECO criteria. Here is the chart to support this conclusion:

The non-trended chart indicates the significance of the 10-year growth for BVF:

Note that the most recent year’s data simply represents a return to the upper end of the normal range.
Perhaps the year-over-year change is an outlier and cause for concern:


Whether measuring the percentage change conventionally or using the absolute value, there is no indication that last year’s results are beyond expectation.
Finally, we should consider the year-over-year variance (delta):

Here again, everything appears normal.

Leave a comment