Temporary Personnel Services Sector — Top-Down Value Profile
It makes sense that they would show up on my screens for out-of-favor stocks. Anything having to do with Personnel Services comports with the legal definition of hearsay — assuming as true what has yet to be proven. In this case, even considering personnel services assumes there are personnel and, defacto, services sufficient to keep them employed. With the economy suspect and the unemployment rate rising, why would any sane investor consider this sector?
Well, why would any sane investor ignore it?
Remember your mother’s sarcastic advice. Just because little Johnny is jumping off the roof the does not mean that you must follow after him. Similarly, just because everyone else is contributing to speculative bubbles in [name the industry of the moment], does not mean you must follow suit. Of course, if you buy into a hot and growing sector, where your chosen stock is undervalued, that is a different matter.
No, the better advice (for value investors, at least) is nothing more mysterious than “buy low and sell high.” Find the unloved sectors, make certain that they are not like the buggy whip industry and departing the market place permanently, and identify the undervalued stocks. In other words, Zig when others Zag. It is the alternative lifestyle choice of equities investment — sure to promote derision among your judgmental neighbors in the investment community.
And that (Zagging as others Zig) is what I plan to do with this review of an out-of-favor sector (an article that is sure to be poorly attended).
So, what is the investment thesis for the industry? The Bible maintained that there will always be poor people among us. In order for there to be poor, there must be some portion of the population against which to contrast them — how would we know they were poor otherwise? By modern standards, the life of the average caveman or woman was impoverished, but, in their day, their lifestyle was, well, average. They had no idea they were poor, and, while the history is incomplete on this front, I doubt any complained of not having an automobile, microwave oven, or, most important among life’s necessities, flat panel TV’s with cable.
This necessity of the non-poor serving as the measure of contrast by which to identify the poor means that (to my skewed logic), no matter what the economy does, there will be some level of employment. Even during the Great Depression, unemployment was around 30 percent. This meant that 70 percent of working-aged Americans were employed.
More importantly, as recent recessions demonstrate, when the economy is poor, companies hire temporary workers to meet short-term needs and to avoid paying the benefits that contribute to overall labor costs. I may be wrong about this, but it seems like a good, wholesome recession benefits the temporary employment agency — where the workers are temporary and the agency is permanent. Recessions create demand for their services, and, equally, important, that demand grows as the economy exists the trough of an economic down-turn. You remember the “job-less” recovery with the last recession, right? Well, every recovery is slow to start and interminable in its length, as employers, weakened by the recession, seek to expand profitably with diminished working capital. And this, too, benefits the temporary employment agency.
So, lets start considering the firms in the industry. First, there are 39 companies listed in Yahoo! Finance. We will eliminate from consideration the Pink Sheet stocks — sorry, but my bride of 20 years would kill her husband for even considering them. So, we will discard the following:
| Stratum Holdings, Inc. | STTH.OB |
| Command Center, Inc. | CCNI.OB |
| Crdentia Corp. | CRDT.OB |
| American Surgical Holdings, In | ASRG.OB |
| Medical Connections Holdings, | MCTH.OB |
| Technology Resources Inc | TGYR.OB |
| Stratus Services Group Inc. | SSVG.OB |
| St Joseph Inc. | STJO.OB |
| Global Employment Holdings, In | GEYH.OB |
That leaves us with 30 (listed with their market caps):
| AMN Healthcare Services Inc. | AHS | 587.7M | |
| Administaff Inc. | ASF | 727.5M | |
| On Assignment Inc. | ASGN | 300.0M | |
| Barrett Business Services Inc. | BBSI | 143.1M | |
| Cross Country Healthcare Inc. | CCRN | 472.4M | |
| CDI Corp. | CDI | 546.1M | |
| Comsys IT Partners, Inc. | CITP | 191.0M | |
| Dice Holdings, Inc. | DHX | 452.0M | |
| Gevity HR Inc. | GVHR | 155.3M | |
| Hudson Highland Group Inc. | HHGP | 310.5M | |
| General Employment Enterprises | JOB | 4.9M | |
| 51job Inc. | JOBS | 529.7M | |
| Kelly Services Inc. | KELYA | 752.1M | |
| Kforce Inc. | KFRC | 363.9M | |
| Korn/Ferry International | KFY | 805.8M | |
| Manpower Inc. | MAN | 5.2B | |
| MPS Group Inc. | MPS | 1.1B | |
| Medical Staffing Network Holdi | MRN | 133.4M | |
| Navigant Consulting Inc. | NCI | 897.9M | |
| Paychex Inc. | PAYX | 12.1B | |
| PeopleSupport Inc. | PSPT | 187.2M | |
| RCM Technologies Inc. | RCMT | 54.4M | |
| Robert Half International Inc. | RHI | 4.0B | |
| Spherion Corp. | SFN | 277.6M | |
| StarTek Inc. | SRT | 124.7M | |
| TrueBlue, Inc. | TBI | 628.5M | |
| TeamStaff, Inc. | TSTF | 9.9M | |
| Volt Information Sciences Inc. | VOL | 314.8M | |
| VirtualScopics Inc. | VSCP | 14.5M | |
| Westaff Inc. | WSTF | 25.7M |
To be fair, this is an imperfect list, since many are not pure temporary employment plays. Nevertheless, we run the analysis for each and the results are:
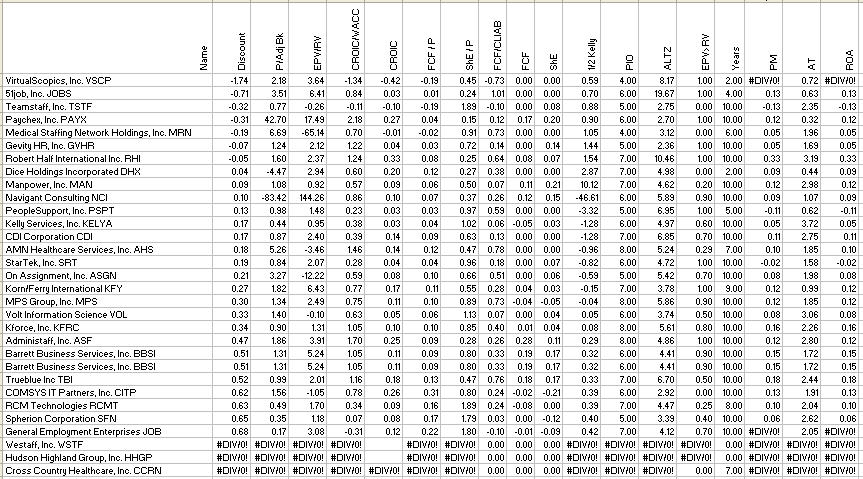
We eliminate those for which there is an abundance of incomplete data — namely, Westaff, Inc. (WSTF), Hudson Highland Group, Inc. (HHGP), and Cross Country Healthcare, Inc. (CCRN). Next, we eliminate those with less than five years worth of data, Altman Z-Scores of 3 or less (bankruptcy risk), Cash Returns on Invested Capital below 10 percent, and Weighted Average Costs of Capital exceeding Cash Return on Invested Capital.
The gray blocks indicate failure to pass the test, the red lettering indicates a failure to pass one or more of the tests, and the green lines are the companies still in the running.
The results narrow things down considerably, but we are not done with the preliminaries.

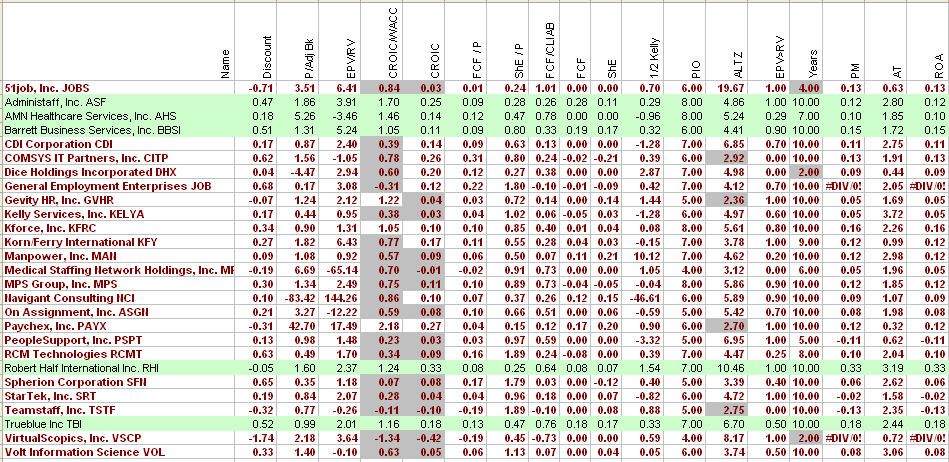
Next we look at whether the stocks provide a sufficient discount to intrinsic value based on discounted cash flows. AMN Healthcare Services, Inc. AHS and Robert Half International Inc. RHI fail to pass the threshold of a 50 percent (0.50) discount. The two stocks are not, however, equivalent. AMN sells at a high price-to-adjusted-book value, has no franchise value (EPV/RV less than 1.00), and has low free cash flow and shareholder’s equity growth. RHI, on the other hand, is cheap on a price-to-adjusted-book basis, has excellent franchise value, etc. The green blocks for each identify the meritorious qualities possessed by both, according to the measures identified here. So, we will coninue consideration of RHI but eliminate AMN from from the list. Each of the other contenders are fine.
Since RHI is on the bubble, let’s consider it in light of Return on Assets.

At 33 percent, ROA is impressive, but this is not why we are interested in ROA. Instead, ROA may be broken out into asset turns and profit margins, and it is those in comparison to the competition that are of greatest interest.

RHI’s 10 percent (red triangle) profit margin and asset turnover rate of 3.19 is the best of those under consideration (yellow triangles), even through the company experienced difficulty in 2002 and 2003 — the red line and dots provide the historical results for the past decade. Indeed, last year was a marginally down year in comparison to the cluster of data points at and, often, above the 33 percent isoquant ROA curve (red line). This is significantly superior to the lowest ROA (Administaff at 12 percent) — the yellow triangle on the purple isoquant curve. Administaff, however, is undervalued by 47 percent, has the second highest franchise value, and posts a Piotroski score of 8 (at 8 or 9, an indication that the stock is prepared to move in the next year). Barrett and Trueblue are undervalued by just over 50 percent, Barrett has the highest franchise value, and Trueblue is selling at just under adjusted book value — a cigar butt stock by Benjamin Graham’s definition.
Why is disaggregating ROA important? It tells us whether the company’s profits follow primarily from volume of business conducted or profit margins. This is important in a down economy, where work volume is expected to decline with employment rates. It is for this reason that we will drop Administaff from consideration. If the industry consolidates and profits come under pressure, Administaff seems the most at risk.
Perhaps the strongest recommendation for RHI is the consistency with which Earnings-Power Value exceeds Replication Value (adjusted-book-value). The difference between the two is our measure of a company’s franchise within its market niche.

For this measure to pay off for investors, it must be consistent and long-term. This is where Trueblue seems more blue than true.

Earning-Power exceeded Replication Value in just 50 percent of years during the prior decade. For this reason, Trueblue fails to make the cut.
BBSI (Barrett) posted EPV greater than RV in 9 of the past 10 years, but just barely in one year (1999).

Truthfully, any of the final four contenders are probably worthy of further consideration, but, as a value investor, we are looking for no-brainers that evidence the ability to fire on all six cylinders consistently. This is why RHI is so troubling with its two down years, and why Barrett is worrisome with its suspect-EPV years. Both, however, occurred during extraordinary times — the tech bubble bursting and the 9/11 attacks and their economic aftermath. We will, therefore, need to focus on the financials in detail.
Nevertheless, we have identified four stocks that are interesting value plays, and two seem especially interesting. Barrett is a Graham-like value, selling at a significant discount to intrinsic value, and RHI is a Buffett-like value, as a quality company that is selling at or just below fair value.
So, which do you like best and why?
Personally, I like both. Let’s start with Barrett.
Barrett Business Services, Inc. BBSI
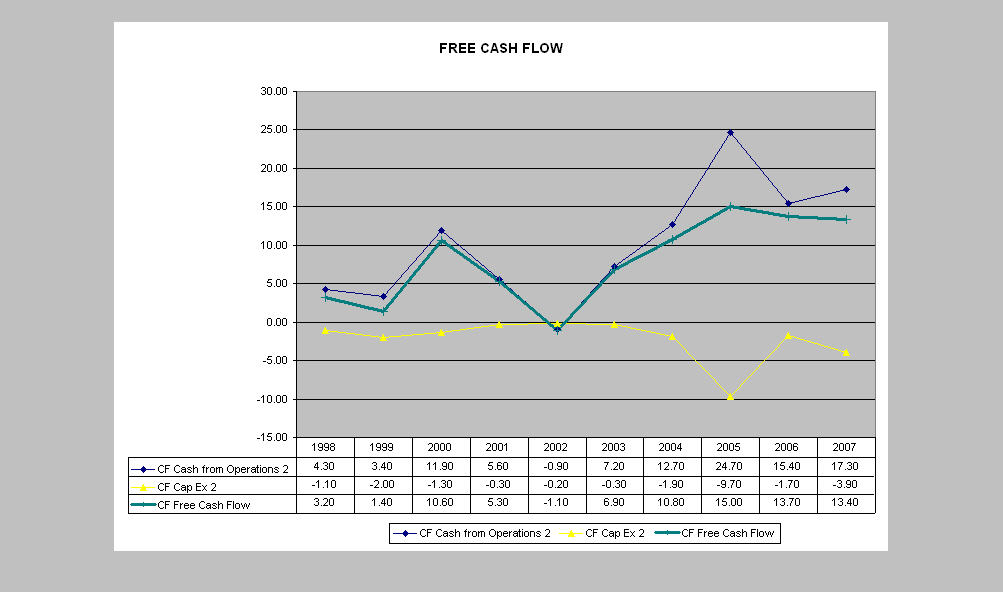
Taking the median of the median five-year and seven-year medians for Free Cash Flow and Cash Return on Invested Capital, we have two points of comparison for our Discounted Cash Flow analysis.

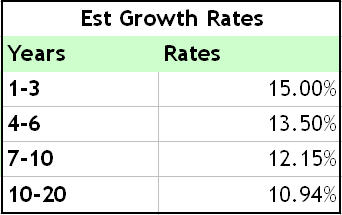
Free Cash Flow (at 18.8 percent) can be expected to incrementally decline to the Cash Return on Invested Capital rate of 15.0 percent, initially, and then to the Weighted Average Cost of Capital rate of 14.29 percent.

We will, therefore, project Free Cash Flows in the future by starting with a 25 percent discount to the median Free Cash Flow growth rate and adjust downward in 10 percent increments as follows:

This provides the projected Free Cash Flows for the next two decades, which we will discount to present at 15 percent. Substituting Shareholder’s Equity for the terminal value and dividing by the number of shares outstanding provides our estimate of intrinsic value.
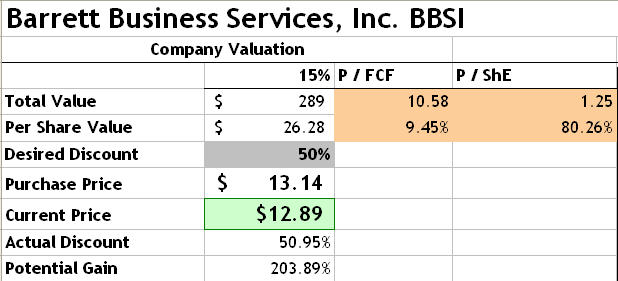
By this measure, the stock is worth $26.28. If requiring a 50 percent discount, we would be willing to purchase at any price below $13.14. If the stock rises to meet its intrinsic value in one year or less, our projected return is 203.89 percent (a double).
If Free Cash Flows do not grow (remain flat), the stock is still undervalued by more than 20 percent.
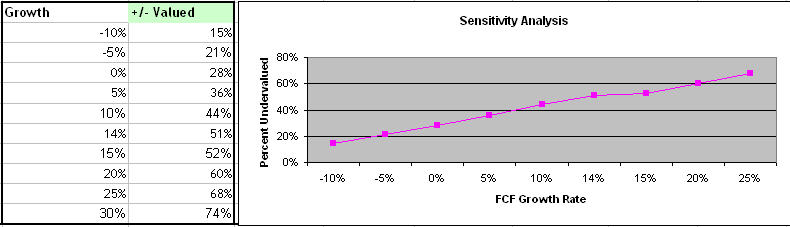
In fact, Cash Flows could drop by 10 percent and the company would still sell at a 15 percent discount.
if the Cash Flows follow our projections and it takes three years for the market to realize its value, what is our return?

On a compounded basis, we are looking at 26.80 percent.
A quick overview of the company’s performance based on the reputed criteria of Warren Buffett renders:
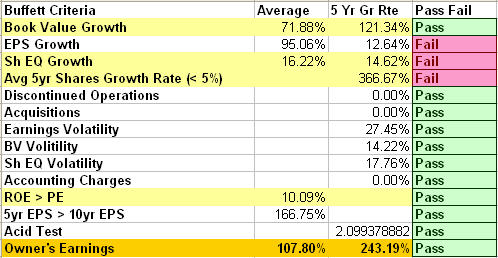
The Earnings Per Share and Shareholder’s Equity warnings indicate a failure to meet the 15 percent threshold in the most recent five years. Neither is particularly disconcerting, but the growth in shares is.

This would ordinarily be enough to be enough to exclude the company from further consideration, but the subsequent results have been impressive.

Owner’s Earnings more than doubled, as did book value and shareholder’s equity. This was attributable to aquisition-based expansion of the business, as the cash from investing figures demonstrate.

With the favorable results showing up in the cash from operations results.

Most companies are not able to translate acquisitions into tangible benefits for the company’s owners, but Barrett has. This is why the comparison between Cash Return on Invested Capital and Weighted Average Cost of Capital is important — to say nothing of our earlier analysis of the company’s franchise value. The favorable results have not yet shown up in an increase in Free Cash Flow.
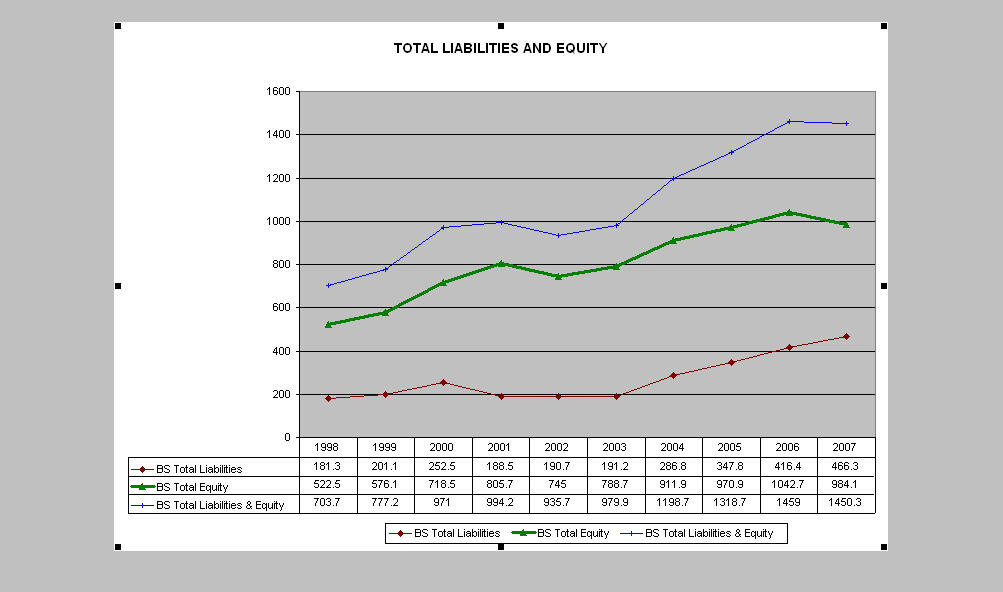
So, at worst, the company has grown without detriment or benefit to stockholders. At best, Shareholder’s Equity grew nicely, as a result — primarily due to the increase in long-term assets and a comparatively smaller increase in total liabilities.

As for debt risk exposure, the company has no debt and the current ratio is a healthy 1.993. There is a significant amount of short interest in the stock, which raises the question of whether they know something we do not. With the exception of Leaps, options traders have short investment time frames — significantly, shorter the anticipated three-year holding period, mentioned earlier.
The book value for the company is just under $10.09 a share, while the replication value is $9.86. Either may be viewed as the floor for the stock price. If wagering that the stock has a 30 percent chance of dropping to its replication value and a 90 percent chance of rising to its DCF intrinsic value, the Kelly Criterion indicates the maximum 1/2 Kelly amount that should be invested is 28 percent.

Next, we turn to RHI.
Robert Half International Inc. RHI
RHI, on the other hand, has a more clean looking set of Buffett Criteria.

The low five-year shareholder’s equity growth rate is disconcerting, since this is what we are ultimately after as investors. Moreover, the strong five year Owner’s Earnings growth is marginally suspect.
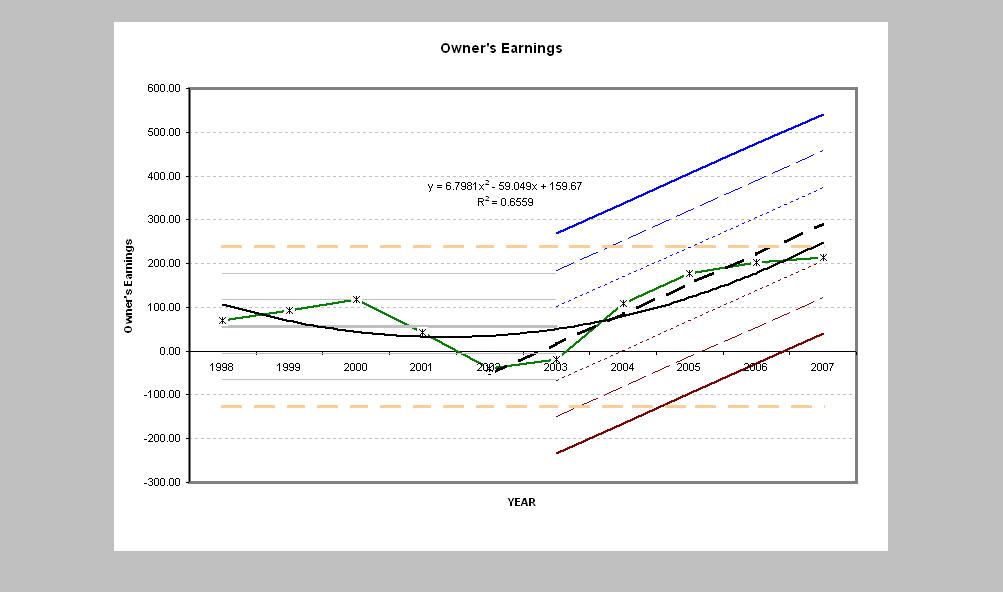
Yes, the most recent results are above the results posted five years and 10 years ago, but the most recent results do not exceed the three standard deviation control limit for the first five years. The three most recent yearly data points are above the two standard deviation line but the rate of growth seems to have slowed. In other words, things are better since the problems in 2002 and 3003, but there is little evidence that company is growing at beyond its 10-year median FCF growth rate of 8.5 percent.

The same appears to be true of Book Value and Shareholder’s Equity.

Cash from Financing has been in decline due to share repurchases.

And there is some marginal reason for concern with the rising level of accounts receivable.

And total liabilities are growing faster than Shareholder’s Equity.
Debt, however, exceedingly small, and the current ratio exceeds 2.0.
The thesis favoring price appreciation is that Free Cash Flow should grow as the economy comes out of recession. Even if believing Free Cash Flow will grow at 15 percent for three years starting next year …
The stock is undervalued by 27 percent, has a 36 percent up-side, and the 1/2 Kelly recommends investing no more than 3.63 percent of the available portfolio (rounded up to 4 percent in the chart below).
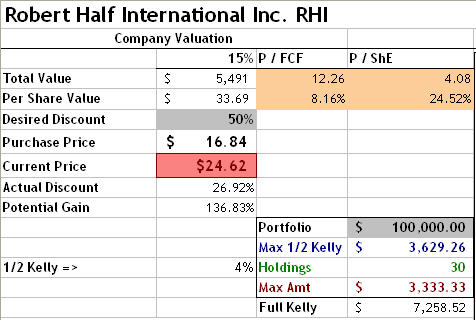
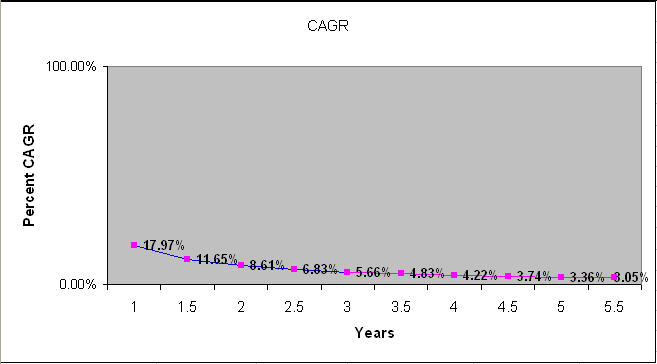
Given what we know of past performance, 12 percent initial growth seems more reasonable. The median Free Cash Flow growth rate, after all, is 8.5 percent — which is less than the Weighted Average Cost of Capital. At that rate of growth, the stock is undervalued by 15 percent.

And our compounded rate of growth at 3 years is 5.66 percent.
Barrett’s price chart, on the other hand, provides a more comforting margin of safety — valuing the stock at somewhere between $20.09 and $29.00 — compared to the current price of just under $13.00.

[Note: Price Chart, above, is for Barrett.]
Personally, Barrett seems the better option, with RHI a hold. Is it a close call? Absolutely. Barrett’s smaller market cap may be off-putting to many investors, while RHI’s stronger tenure and name recognition represents a substantial benefit. One, however, offers a larger margin of safety, and that is the key distinction between the two.
As for full disclosure, I own neither stock as of this writing and am still less than certain about whether to purchase Barrett — which posted seasonal and cyclical declines, according to its latest 10K. Candidly, I am less concerned with quarterly results than with the long-term prospects of the company. I will be working from Richmond most of next week and will revisit the decision when I return.

Wow! Thanks for the great analysis!
Doug
July 11, 2008 at 5:19 am
Thanks, Doug. I’m pleased you found it helpful.
rcrawford
July 11, 2008 at 6:38 am
By the way, I have not yet purchased Barrett. This blog is designed to generate ideas and, more importantly, to describe the fundamental analysis behind value investing. For this reason, I’ve posted entries about my poor choices (P&G), short-term failures (SHLD and AEO), those I elected to avoid (ARAY), and those that seem interesting (whether I’ve put real money behind them or not — Barrett is just one example). I did, however, purchase a small stake in QSII, several days after posting my analysis. The key to this comment is that this blog is not my attempt to pump stocks for personal gain. While this may change if the blog achieves greater popularity, I have the flexibility of posting ideas before taking a position without fear that the market will respond and make the choice “null and void.”
rcrawford
July 11, 2008 at 6:49 am
Very Interesting Data You are provided, thanks for such a nice information….
http://www.pointglobalstaffing.com/
pointglobal
July 19, 2008 at 3:36 am